How to Navigate Google Search Console (Complete Guide)
Google Search Console Navigation: The Quick Version
Google Search Console is organized into a few core sections. If you know where to look, you can find exactly what you need in under 30 seconds.
The core sections you actually use:
- Overview — Quick health check
- Insights — High-level trends and content performance highlights
- Performance — Queries, clicks, impressions, CTR, position
- URL Inspection — Check if a specific page is indexed
- Pages (Indexing) — Indexed vs. not indexed and reasons
- Links — Internal and external linking reports
Everything else is niche or advanced. Start here.
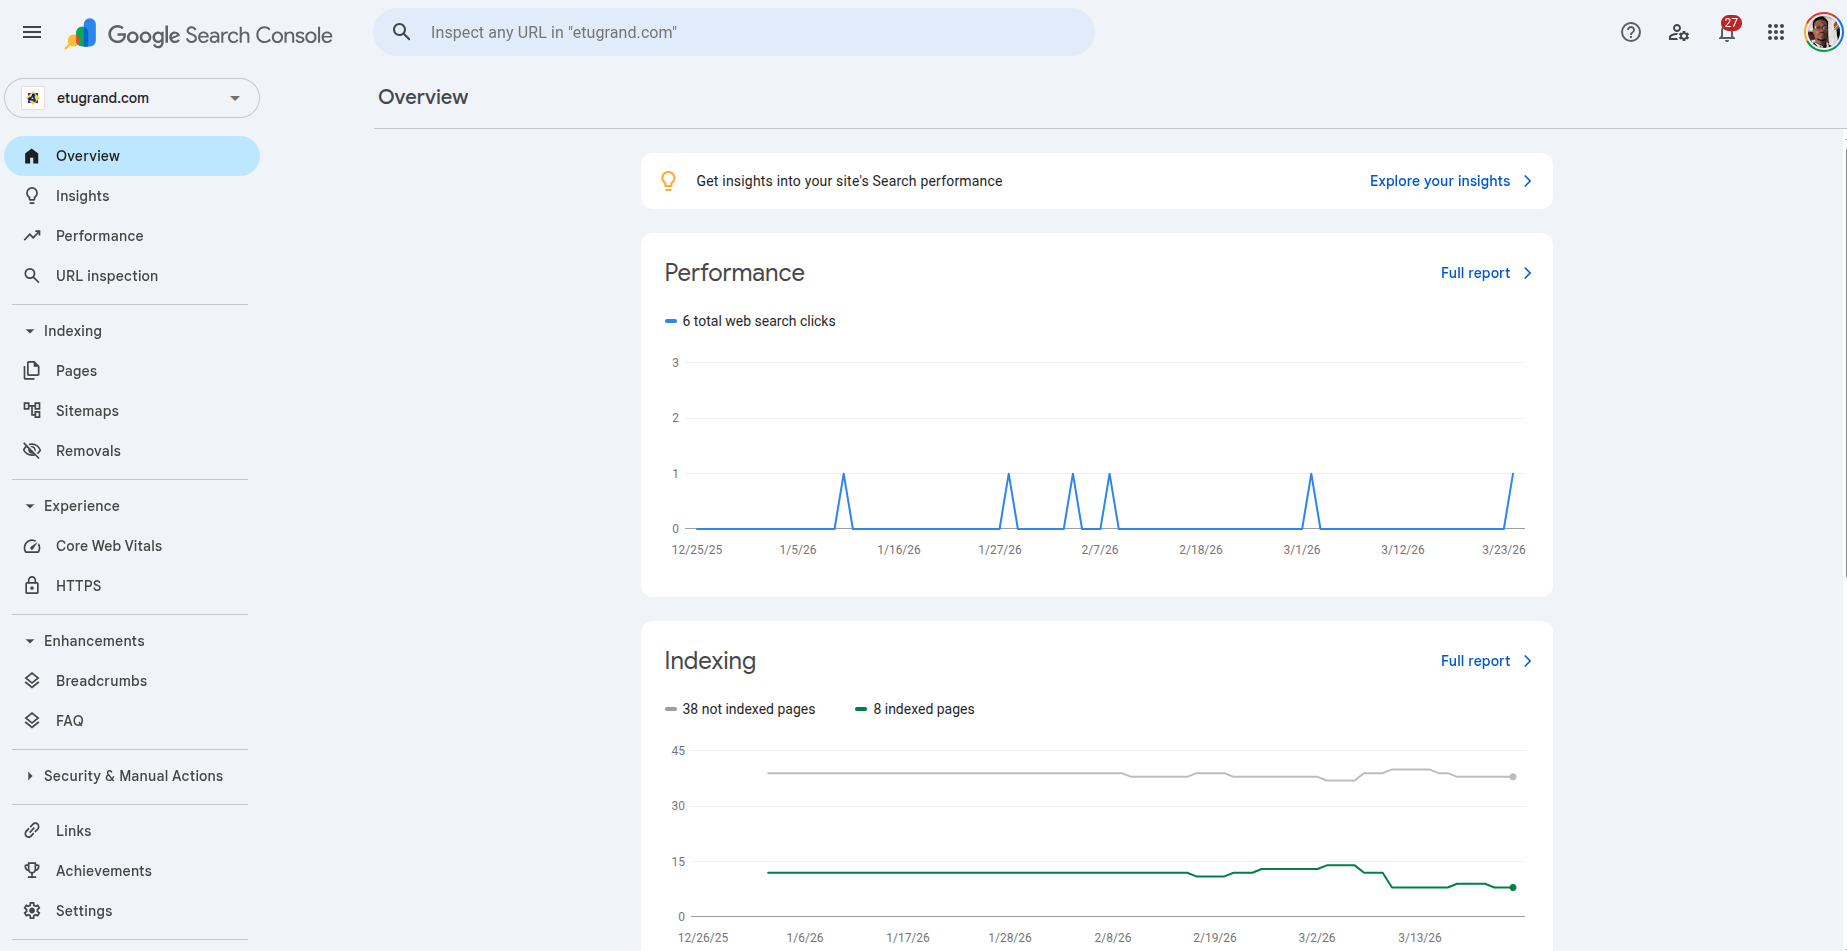
Section 1: Overview Dashboard
Where to find it: First thing you see when opening a property
What it shows:
- Total clicks, impressions, CTR, and average position (last 3 months)
- Top performing queries and pages
- Indexing summary (indexed vs. not indexed)
- Any critical errors or warnings
How to use it: The Overview is your daily health check. If something looks dramatically different from yesterday, investigate. A sudden drop in clicks? Check the Performance report. Spike in indexing issues? Check the Pages report.
Pro tip: Don't make decisions based on Overview alone. It's a summary, not deep analysis. Click through to the full reports for context.
Section 2: Insights
Where to find it: Left sidebar → Insights
What it shows:
- High-level performance trends
- Top pages/content snapshots
- Useful directional signals before deeper analysis
How to use it: Use Insights as a quick pulse check. Then validate decisions in the Performance and Pages reports, where the underlying data is more detailed.
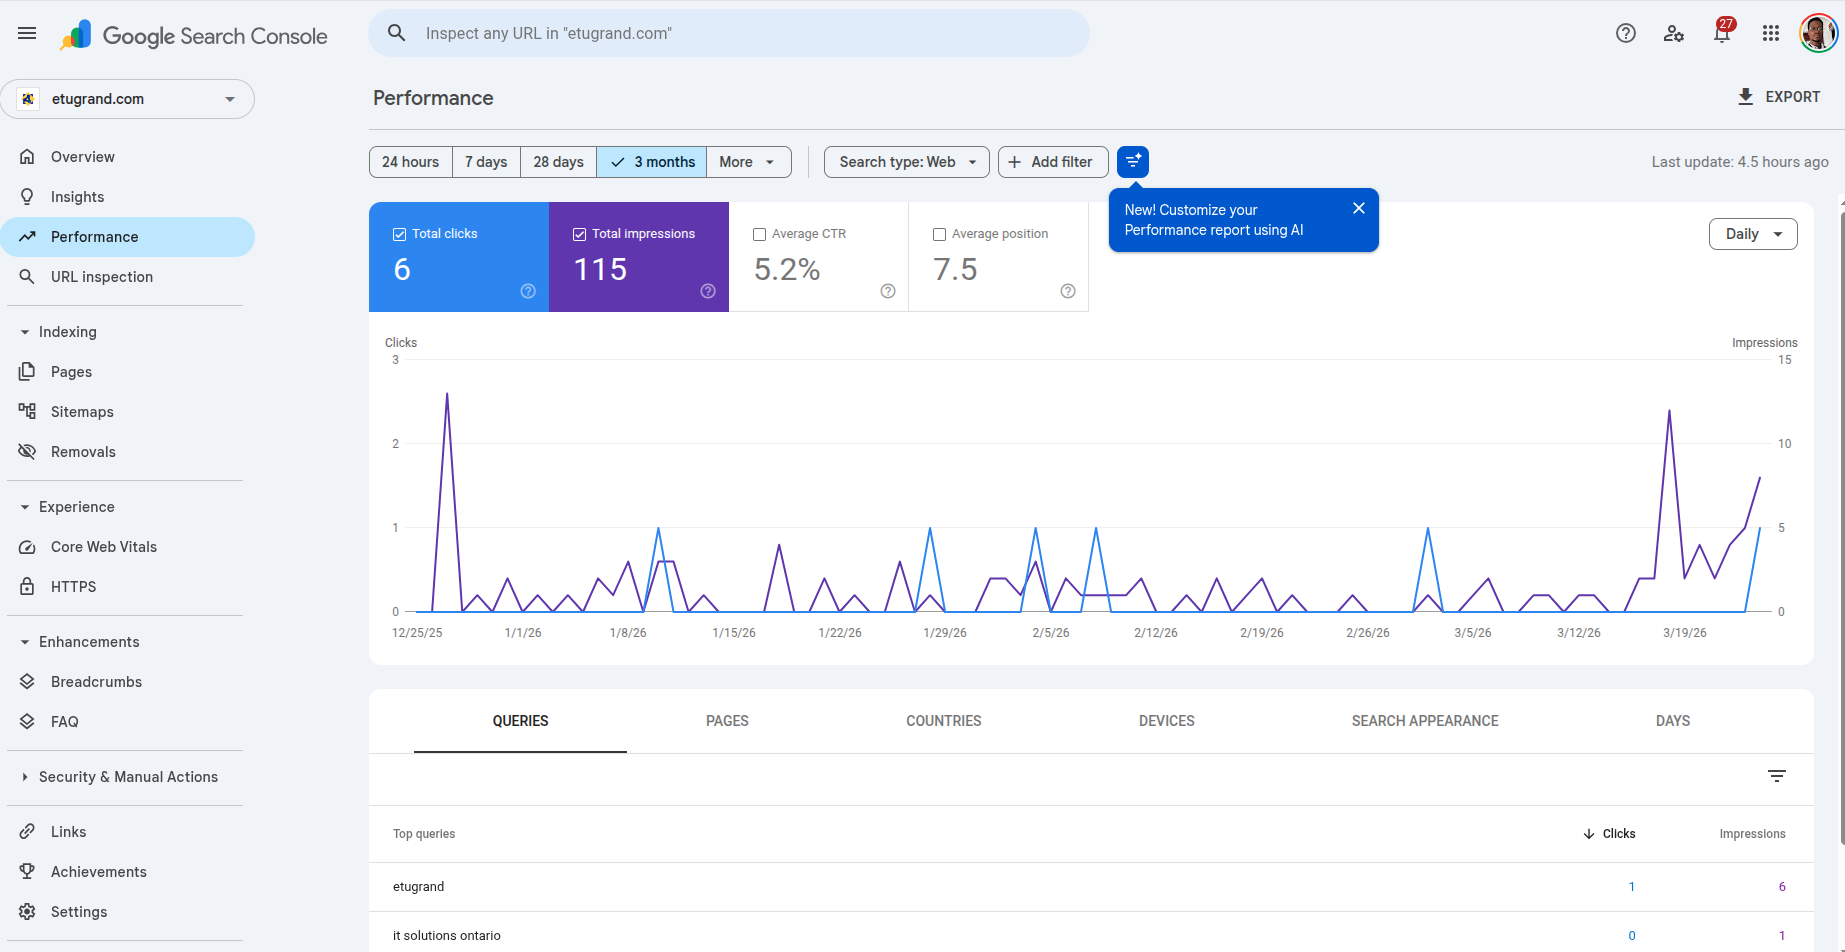
Section 3: Performance Report
Where to find it: Left sidebar → Performance
What it shows:
- Queries tab: Search terms people used to find your site
- Pages tab: Which of your URLs appeared in search
- Countries tab: Which countries your traffic came from
- Devices tab: Desktop vs. mobile vs. tablet
- Search appearance tab: Rich results, featured snippets, etc.
How to navigate it:
Step 1: Set your date range
- Click the date dropdown (top right)
- Choose "Compare" to see two periods side-by-side
- Maximum range: 16 months
Step 2: Choose your tabs
- Start with Queries to see what people search for
- Switch to Pages to see which URLs get impressions
- Use Countries and Devices to segment data
Step 3: Apply filters
- Click "+ Filter" to narrow down
- Filter by query contains "your keyword"
- Filter by page to see data for specific URLs
- Filter by country or device to slice data
Step 4: Sort by impact
- Click column headers to sort
- Sort by Impressions first (opportunity)
- Then sort by CTR to find title/meta problems
- Then sort by Position to find quick wins (positions 4-10)
What to look for:
- Queries where you rank positions 4-10 with high impressions (quick wins)
- Pages ranking top 3 but with below-average CTR (title/meta problems)
- Queries you get impressions for without a dedicated page (content gaps)
- Rising impressions but flat clicks (content-intent mismatch)
Common issue: "No data showing?"
- Confirm you selected the right property (domain vs URL-prefix mismatch is common)
- Expand the date range to at least 3 months
- Remove filters to confirm data exists before narrowing down
- Check if your site was recently verified or migrated
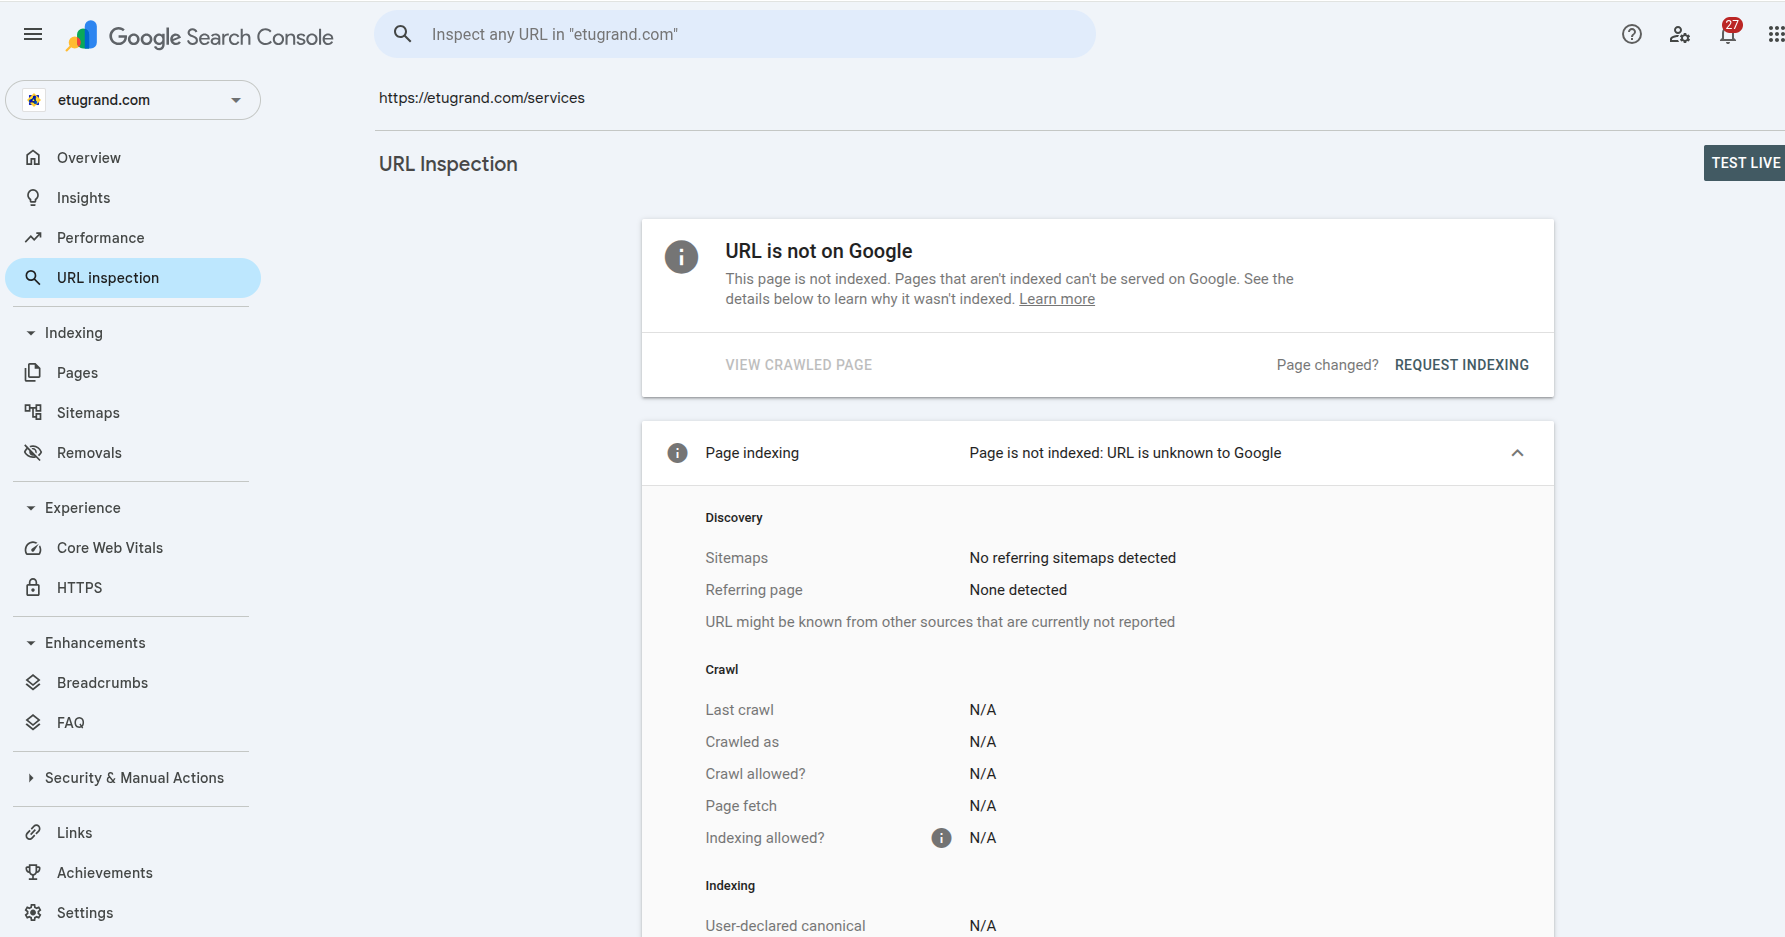
Section 4: URL Inspection Tool
Where to find it: Top search bar (paste any URL from your site)
What it shows:
- Whether Google has indexed the URL
- When Google last crawled the page
- Any crawl or indexing errors
- Enhancement detection (for example, structured data)
- The indexed version of the page (how Google sees it)
How to use it:
To check if a page is indexed:
- Paste the URL in the search bar at the top
- Press Enter or click the search icon
- Look at the "URL is available on Google" (indexed) or "URL is not on Google" (not indexed)
To request indexing:
- Run the URL inspection
- Click "Request indexing" (if page is not indexed)
- Google will crawl within a few hours to a few days
To see how Google rendered your page:
- Run the URL inspection
- Click "View crawled page" or "View indexed page"
- This shows you the HTML Google sees, which may differ from what users see (JavaScript rendering issues, blocked resources, etc.)
Common use cases:
- Published a new page and want to confirm it's indexed
- Changed a page and want Google to recrawl it
- Diagnosing why a page isn't ranking (is it even indexed?)
- Checking if schema markup is detected
Section 5: Pages Report (Indexing)
Where to find it: Left sidebar → Pages (formerly "Coverage")
What it shows:
- Which pages on your site are indexed
- Which pages are excluded from indexing
- Why pages are excluded (noindex, blocked by robots.txt, duplicate, error, etc.)
- Warnings and errors that prevent indexing
Status categories:
Valid:
- Valid: Page is indexed and appearing in search
- Valid with warnings: Indexed but has issues (soft 404, indexed despite canonical)
Excluded:
- Excluded by noindex tag: Page has a noindex meta tag
- Blocked by robots.txt: Robots.txt disallows Google from crawling
- Not found (404): Page returns a 404 error
- Duplicate without user-selected canonical: Google chose canonical, you didn't specify
- Duplicate without submitted canonical: You submitted a sitemap, Google sees duplicates
Error:
- Server error (5xx): Your server returned an error when Google tried to crawl
- Redirect error: Redirect chain is too long or broken
How to use it:
Check for errors first:
- Click "Error" to see critical indexing problems
- Fix these immediately — these pages are completely missing from search
Then check warnings:
- Click "Valid with warnings" to see indexed pages with issues
- These are indexed but may not perform as well as they could
Then check exclusions:
- Review "Excluded" pages to confirm they're supposed to be excluded
- If you see important pages excluded, investigate why
Pro tip: Download the full report (click the export icon in the top right) to analyze all your URLs in a spreadsheet. Look for patterns — are all blog posts excluded? Are product pages getting errors?
Common issue: "Errors not updating?"
- After fixing the issue, click "Validate fix" and wait for recrawl
- Re-check the affected URLs in URL Inspection
- Expect delays: status updates can take days, not minutes
- Confirm your fix is on the live page (not only in staging)
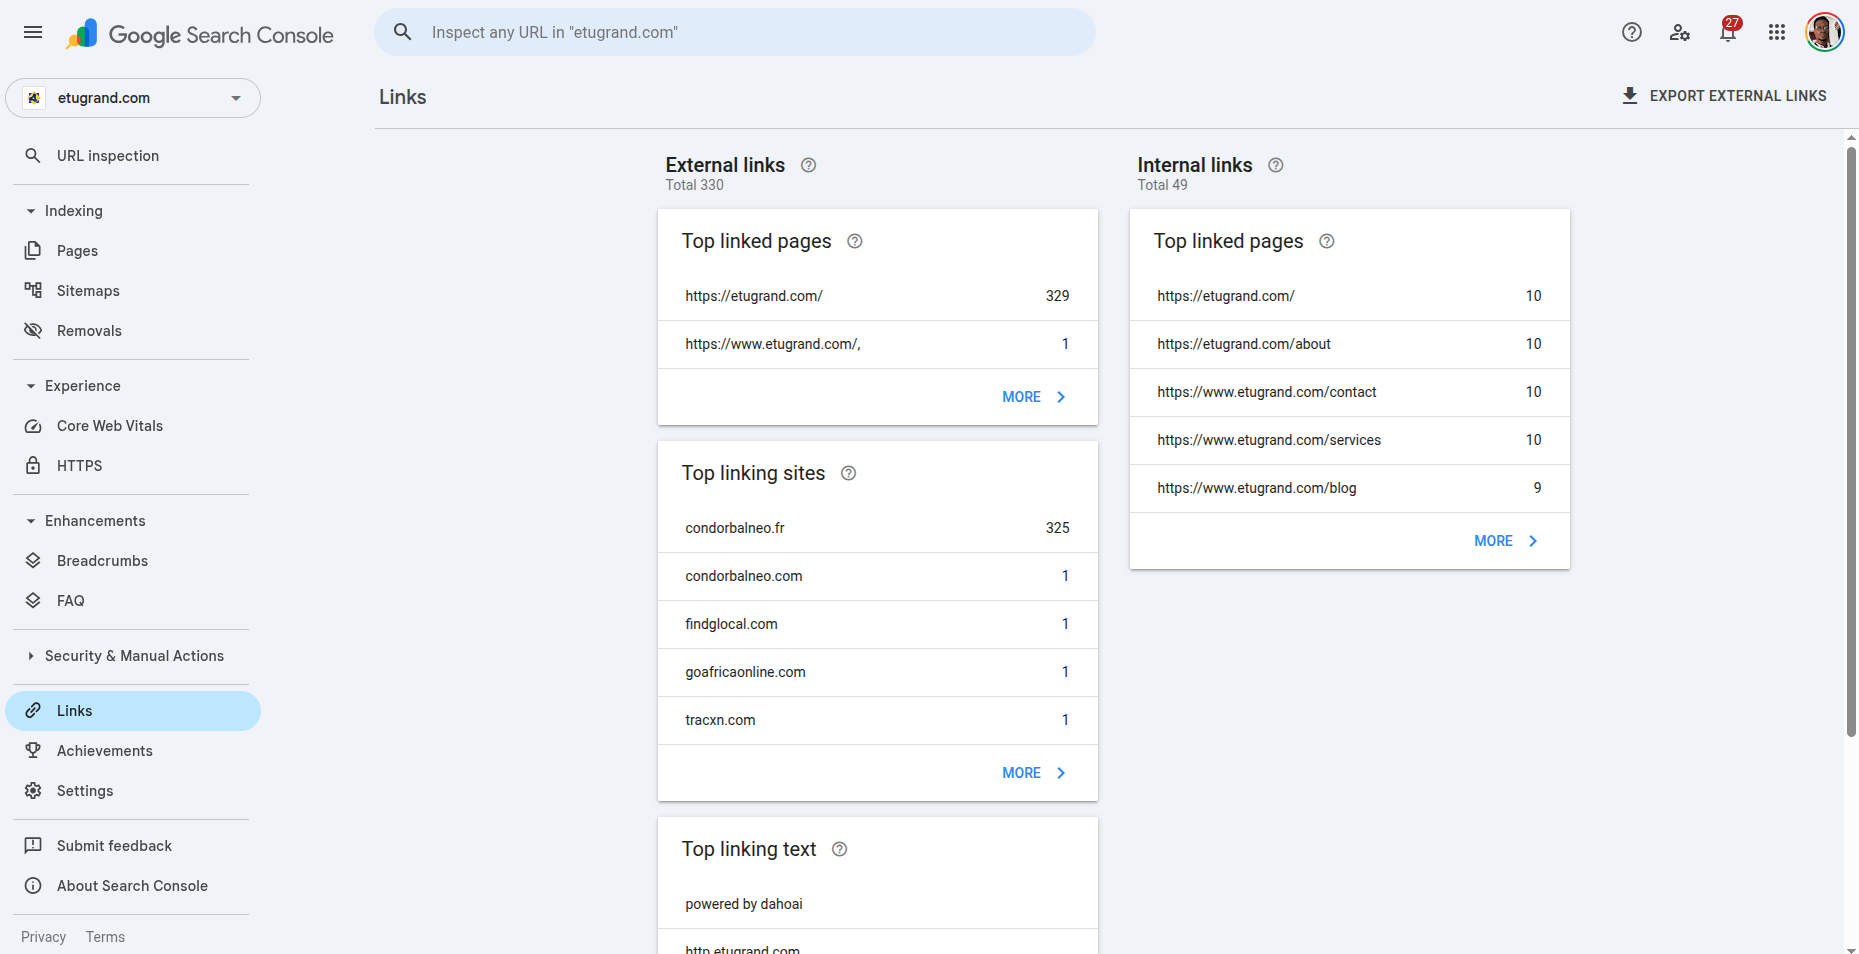
Section 6: Links Report
Where to find it: Left sidebar → Links
What it shows:
- External links: Which sites link to you, and which pages on your site they link to
- Internal links: How you link between your own pages
- Top linked pages: Your pages with the most backlinks
- Top linking sites: External domains that link to you the most
- Top linking text: The anchor text people use when linking to you
How to use it:
Find your strongest pages:
- Click "Top linked pages" under "External links"
- These pages have the most backlink authority
- Consider internally linking from these pages to pages you want to rank
Check for toxic links:
- Review "Top linking sites"
- Look for spammy or low-quality sites
- If you see concerning patterns, use the Disavow Links Tool
Optimize internal linking:
- Click "Internal links"
- See which pages you link to most frequently
- Ensure your most important pages have strong internal link support
What to look for:
- High-authority pages that you're not fully utilizing (add internal links from these to target pages)
- Important pages with few internal links (build internal link structure)
- Unexpected drops in backlinks (maybe a site removed their link to you)
Common issue: "No backlinks showing?"
- New properties often need time before link data appears
- GSC link data is sampled and not a full backlink index
- Check whether you are in the correct property variant
- Compare with third-party tools for broader backlink coverage
Section 7: Enhancements (If Available)
Where to find it: Left sidebar → Enhancements
What it shows:
- Property-specific enhancement reports (for example, FAQ rich results)
- Structured-data opportunities or issues when applicable
How to use it: These are niche reports. Check them if you suspect specific issues:
- Rich results not showing? Check enhancement-specific reports (like FAQ if present)
- Schema changes deployed? Re-check enhancement validation status
Section 8: Security & Manual Actions
Where to find it: Left sidebar → Security & Manual Actions
What it shows:
- Manual action penalties (if any)
- Security issues detected by Google
How to use it: If anything appears here, treat it as urgent. These issues can directly reduce visibility in search.
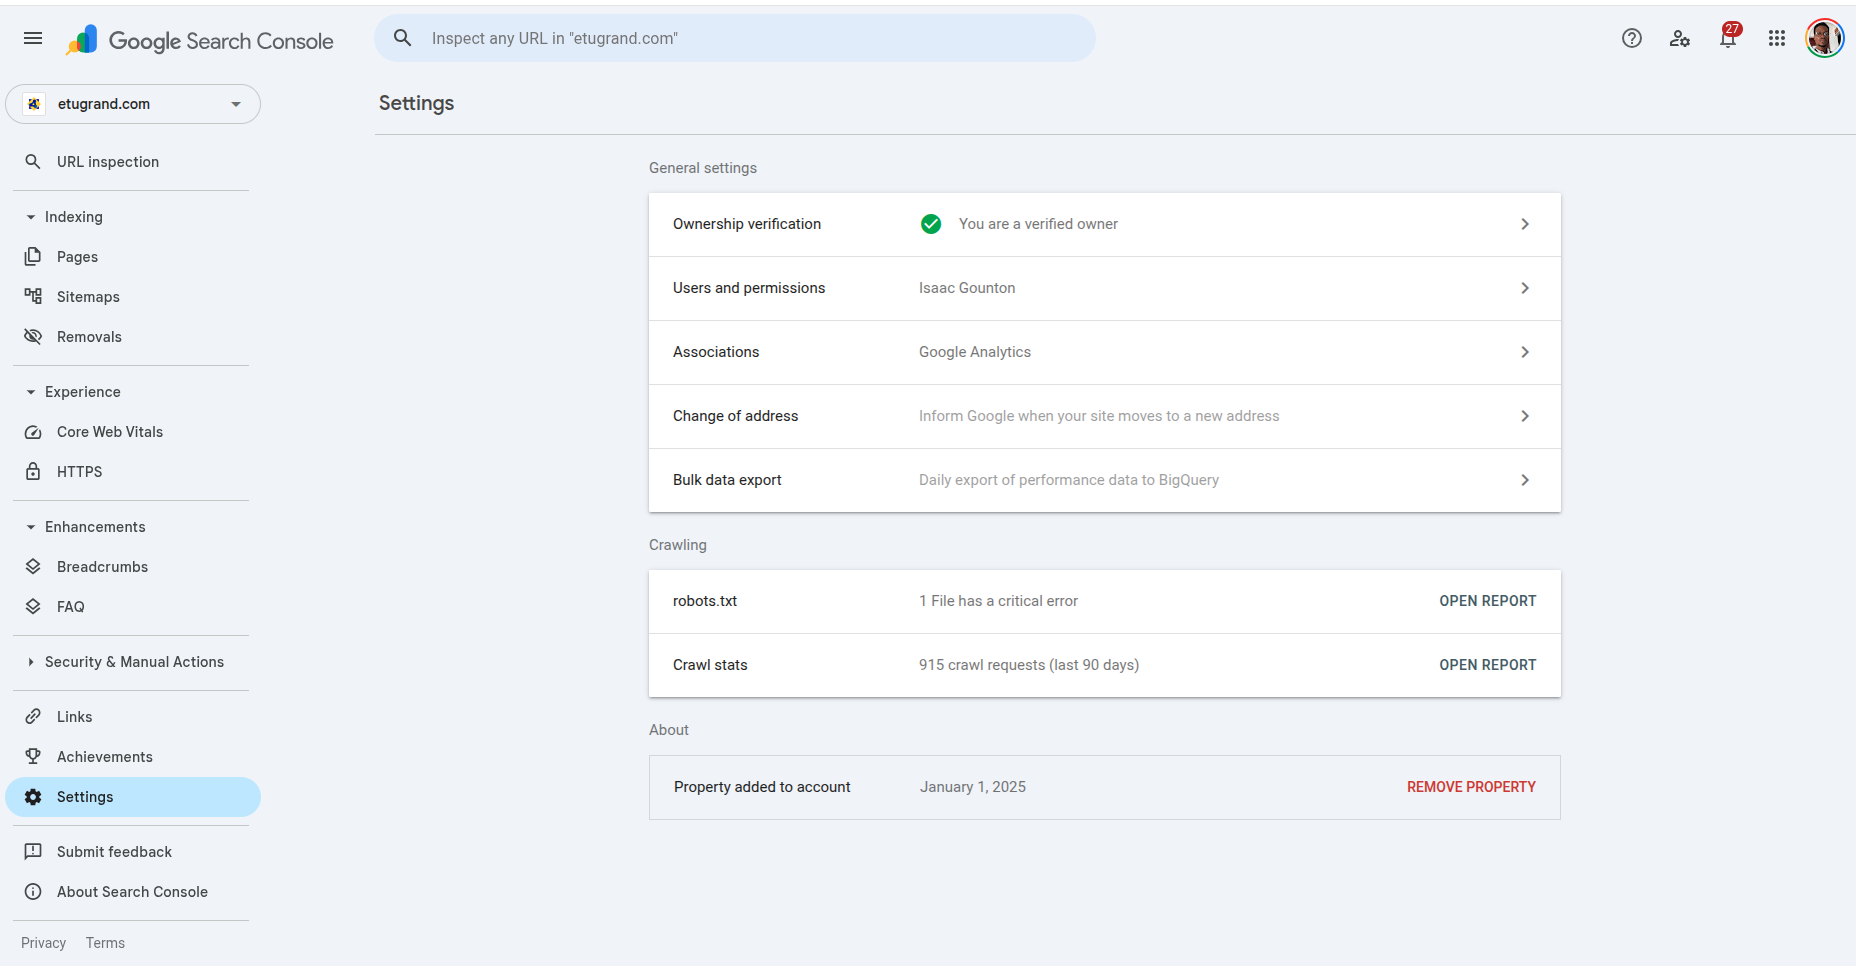
Section 9: Settings (Site Configuration)
Where to find it: Left sidebar → Settings (gear icon)
What it shows:
- Users: Who has access to this GSC property
- Ownership verification: How you verified ownership of the site
- Associations: Linked Google Analytics, Search Console Actions, etc.
- Domain property vs. URL prefix: Which type of property this is
How to use it: Mostly administrative. Check here when:
- Adding team members to GSC
- Verifying site ownership
- Connecting Google Analytics
Navigation Cheat Sheet
| What You Want to Find | Where to Go |
|---|---|
| Quick summary trends | Insights |
| Search performance data | Performance report |
| Check if a page is indexed | URL Inspection tool |
| See indexed vs excluded pages | Pages report (Indexing) |
| Find backlinks to your site | Links → External links |
| Check internal link structure | Links → Internal links |
| Check for penalties | Security & Manual Actions |
| Check rich result enhancement status | Enhancements (for example, FAQ) |
| See Core Web Vitals issues | Experience → Core Web Vitals |
Which Sections to Check Daily, Weekly, Monthly
Daily: Overview (or Insights) for quick health changes
Weekly: Performance for quick wins, declines, and CTR opportunities
Monthly: Pages report for indexing health, Links for authority patterns, and Security & Manual Actions for risk checks
Official Google References
- Search Console overview
- Performance report
- URL Inspection tool
- Pages indexing report
- Links report
- Manual actions report
- Security issues report
Pro Tips for Efficient Navigation
UI note: Google Search Console navigation changes over time. If a label in this guide differs from your property, prioritize the current sidebar labels in your account.
Keyboard shortcuts:
- Press "/" to focus the search bar (paste URLs instantly)
- Use tab to navigate between filters
Custom date ranges:
- Set your preferred date range once, then bookmark the URL
- Next time you visit, click the bookmark to jump straight to that view
Comparison mode:
- Always use "Compare" to see period-over-period changes
- Compare this month to last month, or this year to last year
- Seasonality makes raw numbers misleading without comparison
Export and analyze:
- Download reports to CSV for deeper analysis
- Combine GSC data with Analytics data for complete picture
- Use exports to track changes over time (beyond 16 months)
What's Next?
Now that you can navigate GSC like a pro, learn how to interpret what the data actually means:
- Read Google Search Console Like a Strategist — The 5 patterns that reveal opportunities, threats, and quick wins in your GSC data
- GSC Historical Data Guide — How to export and preserve your data before Google deletes it
Founder of DadAds. I build tools that turn ADS data into strategy — not scores. Previously spent years running audits that told me what was broken without telling me what mattered.
Read more about me →Ready to see what your ADS data actually means?
DadAds connects to Google Search Console and gives you a strategic diagnosis — threats, gaps, and opportunities ranked by impact.
Get Your Free Audit